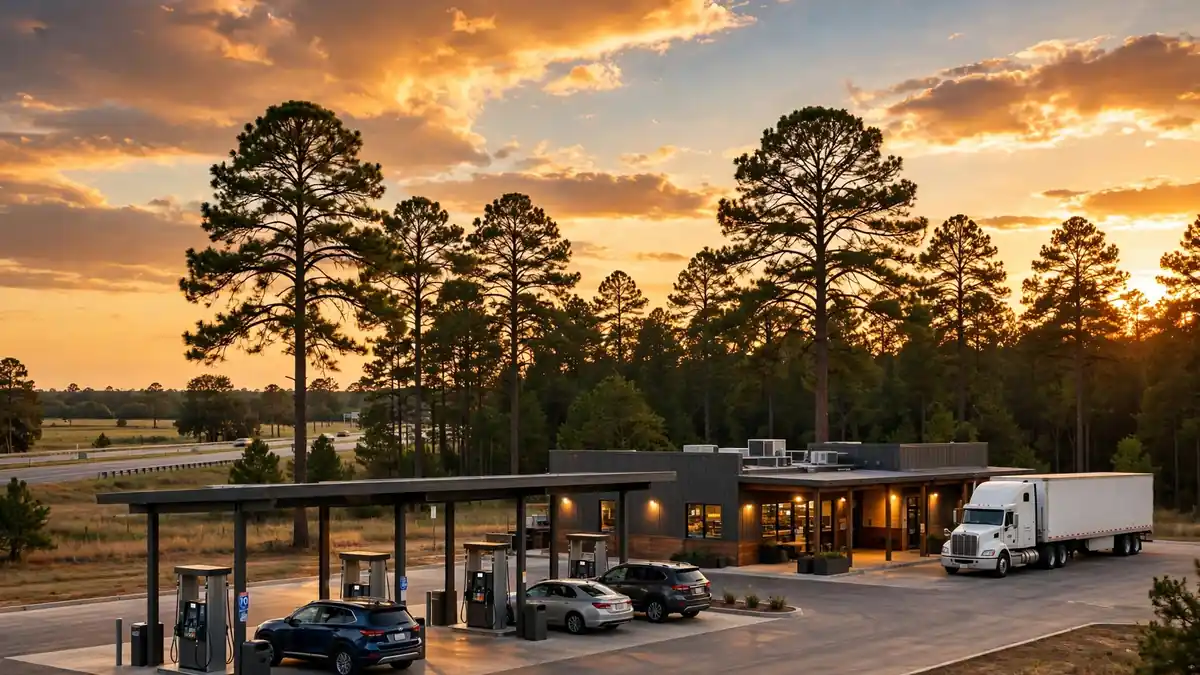


On a Tuesday morning in Carlsbad, a satellite the size of a school bus carries a video call from a jet at 40,000 feet. Down the road, a surgeon reviews a spinal implant that an algorithm designed for one patient. In a third building, a rack of GPUs is being rewired in software, not by hand. Three different kinds of infrastructure. One small coastal city. And one lesson that matters to every executive trying to scale: velocity is not bought with marketing spend. It is built into the technical foundation, long before the customer ever sees a product.
Carlsbad is not Silicon Valley. It has about 111,835 residents (World Population Review, 2026), and it is the fifth-largest city in San Diego County. Yet companies in the Carlsbad tech ecosystem generate 1.6 times more patents per 1,000 workers than San Jose does (Nucamp, 2026). Median tech wages sit near $130,000. The city runs on three deep clusters: satellite communications, biotech and medtech — the locals call it “Titanium Valley” — and a fast-growing AI layer built on top of both. That combination makes Carlsbad a useful place to study. It shows what high-velocity technical infrastructure looks like when it is built by specialists, not by hype.
This guide is the executive’s blueprint. It covers what an enterprise ecosystem really is, why Carlsbad punches above its weight, how big the 2026 infrastructure shift is, the six decisions that decide velocity, and a 90-day plan to act on. Every number comes from a named source. The worked example is labelled as an illustration, not a promise.
What does an enterprise ecosystem actually mean?
An enterprise ecosystem is not a single system. It is five layers that must move together. Compute is the first layer: servers, GPUs, cloud capacity, and the data centres that house them. Connectivity is the second: fibre, 5G, satellite links, and the networks that join offices, factories, and customers. Data is the third: the pipelines, warehouses, and governance rules that turn raw signals into decisions. Applications are the fourth: the software that employees and customers touch every day. People are the fifth: the engineers, operators, and partners who keep the other four layers alive.
Scaling enterprise ecosystems starts with the five layers, not with the shopping list. Most scaling failures are not failures of ambition. They are failures of one layer lagging behind the rest. The global business services economy runs on the same five layers, and its story shows how the referral economy met the digital-first buyer. A company buys AI tools before it fixes its data pipelines. It signs a cloud contract before it checks whether its network can carry the traffic. New engineers arrive before the power and cooling exist for the machines they need. The ecosystem view exists to stop that. It forces the executive to ask one question about every investment: what breaks next if this layer grows?
That question matters more in 2026 than it did three years ago. Cloud infrastructure spending 2026 reached $167.7 billion in the third quarter alone, up 55% year on year (Synergy Research Group, 29 October 2026). The growth rate has risen for twelve straight quarters. The market has doubled in size in eight quarters. AI-specific cloud services now account for around a third of the total. The companies that scale fastest are not the ones that spend the most. They are the ones whose five layers grow in step.
Why does Carlsbad punch above its weight?
Carlsbad’s advantage is specialisation. The city does not try to do everything. It does three things deeply, and the depth compounds. The first cluster is satellite communications, anchored by the Viasat Carlsbad headquarters. The company was founded in 1986 and keeps its headquarters at 6155 El Camino Real in Carlsbad. It employs about 7,000 people worldwide, with roughly 2,000 of them local (Nucamp, 2026). Fiscal 2026 revenue reached $4.64 billion. Communication Services generated $3.30 billion of that, and Defense and Advanced Technologies generated $1.34 billion (Viasat, fiscal 2026 results).
The second cluster is biotech and medtech. Thermo Fisher Scientific anchors it, and a wave of genomic and device startups grows around it. Life sciences and healthcare jobs in the San Diego region grew 13–16% over the past decade. The third cluster is AI, and it is the newest. Carlsmed and GigaIO lead it, and both show how Carlsbad’s old strengths feed its new ones. One applies AI to spinal surgery. GigaIO applies composable infrastructure to AI workloads. Neither company would exist in the same form without the clusters beneath it.
The talent numbers explain why people stay. Demand for AI and machine learning skills in the region runs at more than double the supply. AI engineers in Carlsbad earn $162,140 to $233,833 (Nucamp, 2026). Viasat pays AI engineers up to $249,000. Qualcomm pays up to $272,000 for on-device AI roles. Median household income in the city is $142,748 (U.S. Census Bureau, 2024 American Community Survey). The median home value is $1,070,500. The climate is mild all year, and the Pacific is ten minutes from most offices. That is not a small thing. Infrastructure is built by people, and people stay where the work is interesting and the life is good.
How big is the infrastructure shift in 2026?
The numbers are large enough to change boardroom maths. Enterprise ecosystem scaling 2026 is defined by one shift: compute demand is outrunning the physical world that houses it. The table below puts the shift in one place, with the source beside every figure. The pattern is consistent: compute demand is growing far faster than the physical world that houses it.
| Measure | Figure | Source |
|---|---|---|
| Global cloud infrastructure spending, Q3 2026 | $167.7 billion, up 55% year on year | Synergy Research Group, 29 October 2026 |
| Trailing twelve-month cloud revenue | $558 billion | Synergy Research Group, 29 October 2026 |
| Cloud market growth since ChatGPT’s launch | Up 185% since 2022 | Synergy Research Group, 29 October 2026 |
| AI-specific cloud services, share of market | Around one third | Synergy Research Group, 29 October 2026 |
| Cloud market share, Q3 2026 | AWS 26%, Azure 19%, Google Cloud 16% | Synergy Research Group, 29 October 2026 |
| Hyperscaler IT load, 2025 to 2035 | 24.37 GW to 147.13 GW | ABI Research, 2026 |
| Hyperscaler sites, 2025 to 2035 | 3,182 to 3,558 | ABI Research, 2026 |
| Hyperscale data centre market, 2030 | $281.16 billion, 18.4% CAGR | The Business Research Company, 2026 |
| AI cloud infrastructure market, 2024 to 2032 | $2.83 billion to $74.15 billion, 54.1% CAGR | Market research, 2026 |
| Microsoft data centres added, September 2026 quarter | 24, taking the total past 500 facilities in 34 countries | Microsoft, October 2026 |
The industry now calls these buildings AI factory infrastructure: they train, fine-tune, and run models at scale, and they generate intelligence as their output. Read the table carefully, because it holds a warning. Hyperscaler IT load is forecast to rise sixfold by 2035, from 24.37 gigawatts to 147.13 gigawatts (ABI Research, 2026). The number of sites rises only modestly, from 3,182 to 3,558. That means the growth is not in new buildings. It is in denser, hotter, more power-hungry buildings. Available capacity is projected to jump from 33.96 gigawatts to 228.96 gigawatts. ABI Research is blunt about the bottleneck: power, cooling, and grid access now decide who can scale, not land or concrete.
The cloud providers know it. Microsoft added 24 data centres in the September 2026 quarter alone, taking its network past 500 facilities across 34 countries. GPU deployment times fell 20% quarter on quarter. Copilot workload throughput rose by more than 50%. The company’s Maia 300 systems are projected to deliver 40% more tokens per watt than standard GPU-based units. Capital expenditure is expected to exceed $50 billion in the December 2026 quarter (Microsoft, October 2026). Amazon, Microsoft, and Alphabet spent $167,981 million on property and equipment in the third quarter of 2026 — roughly equal to the entire quarter’s cloud infrastructure revenue (Axis Intelligence Research, 2026).
Gartner forecasts worldwide infrastructure-as-a-service spending of $292 billion in 2026, up 31.3%, and $367 billion in 2027, up 25.7% (Gartner, October 2026). IDC expects all public cloud spending to pass $1 trillion in 2026, growing more than 21%. The message for an executive is simple. The infrastructure market is not slowing down. The constraint has moved from money to physics: megawatts, cooling, and the time it takes to connect a new site to the grid.
What are the six infrastructure decisions that decide velocity?
Every enterprise ecosystem faces the same six decisions. They are not technical details for the IT department. Each one is a board-level choice, because it locks in cost, speed, and risk for years. The sections below take them one at a time.
Where should the compute live?
Compute has three homes now: the public cloud, a private data centre, and the edge. The public cloud wins on speed of deployment. A team can rent a thousand GPUs this afternoon. A private data centre wins on control and on predictable cost at steady load. The edge wins on latency, because the work happens where the data is born. Most enterprises need all three, and the mistake is choosing one as a religion. Edge computing enterprise deployments win on latency, because the work happens where the data is born.
Microsoft’s own behaviour shows the mix. It runs more than 500 facilities, yet it also builds custom silicon to cut the cost of each token. The Maia 300 is a bet that owning the hardware layer matters when you operate at that scale. A smaller enterprise cannot copy the scale. It can copy the logic: put bursty, experimental work in the cloud, put steady, heavy work where it is cheapest, and put latency-sensitive work at the edge.
The numbers support the mix. Public infrastructure and platform services grew 59% in the third quarter of 2026 (Synergy Research Group). That is the fastest part of the market. But the hyperscalers are also building private, sovereign capacity for customers who cannot use shared infrastructure. The right question is not “cloud or on-premise?” It is “which workload belongs where, and what does it cost to move it later?” The technology package underneath that decision — the stack, the tooling, the integration layer — deserves the same scrutiny as the workloads themselves. Enterprise cloud migration 2026 is no longer a lift-and-shift project. It is a workload-by-workload decision about cost, latency, and control.
How fast must the network be?
Speed is not one number. It is three: bandwidth, latency, and reliability. Bandwidth is how much data moves. Latency is how long each packet takes. Reliability is whether the link is there when it matters. Most executives buy bandwidth and forget the other two. That is backwards. A video call needs low latency more than it needs raw speed. A backup job needs bandwidth more than it needs low latency. A hospital needs reliability more than either.
Carlsbad’s satellite cluster exists because reliability matters more than speed in some places. Satellite connectivity enterprise buyers need reliability first. The network must work where the customer is, not where the office is. Viasat’s in-flight connectivity systems were installed and in service on about 4,580 commercial aircraft and about 2,100 business jets as of 31 March 2026. The company also provided Ka-band services to about 13,200 vessels. Its U.S. fixed broadband business had about 130,000 subscribers. None of those customers can run a fibre cable to a plane or a ship. The network must work where the customer is, not where the office is.
For most enterprises, the practical rule is simple. Measure latency to the places that matter: the factory floor, the remote office, the customer. Then buy the link that fixes the worst number, not the biggest number. A 10-millisecond improvement in a trading or control system can be worth more than a tenfold bandwidth increase that nobody notices.
What happens to the data?
Data is the layer most companies neglect until it stops them. AI makes the neglect expensive. Models are only as good as the data they train on, and the data is usually scattered across a dozen systems, in different formats, with different owners. The result is familiar: a team spends months cleaning data before it can run a single experiment.
ResMed shows the alternative. The Carlsbad company runs a cloud-native stack on AWS and Azure, and it turns connected sleep and respiratory devices into real-world datasets at scale. The devices generate the data. The cloud stores it. The models learn from it. That loop only works because the data layer was designed first, not bolted on later. The lesson is general. The business technology solutions that turn raw signals into decisions are only as good as the pipelines feeding them. Design the data pipeline before you buy the model.
Governance belongs in the same decision. Who owns each dataset? Which teams can see it? How long is it kept? The answers are legal as well as technical, and they differ by country. Get them wrong and the fastest infrastructure in the world becomes a liability. Handled well, the data becomes the moat.
Who pays the power bill?
Power is the new bottleneck. ABI Research projects hyperscaler capacity rising from 33.96 gigawatts to 228.96 gigawatts by 2035, while under-the-roof capacity grows from 45.08 gigawatts to 276.63 gigawatts. That is a sixfold increase in a decade. The grid was not built for it. Operators now prioritise access to high-capacity transmission, long-term power agreements, and dedicated energy sources. A site without a power contract is a building, not a data centre. Data center power cooling decides which sites can scale and which cannot. Hyperscale data centers 2026 are defined by power density, not floor space.
The cost shows up in the cloud bill too. Energy is a large share of the price of compute, and it rises with density. Liquid cooling, which was exotic five years ago, is now standard for AI clusters. The Maia 300’s 40% improvement in tokens per watt is not a curiosity. It is the difference between a workload that pays and one that does not. Executives should ask their providers one question: what is the energy cost per unit of work, and how is it trending?
For a Carlsbad enterprise, the power question has a local twist. California’s grid is cleaner than most, but it is also constrained. A company that plans a new lab or data hall should start the power conversation at the same time as the property conversation. Waiting until the building is ready can add a year to the schedule.
How sovereign must the stack be?
Sovereignty means control over where data lives, who can touch it, and which laws apply. It matters most in defence, healthcare, and finance. GigaIO, the Carlsbad infrastructure company, built its business on it. Its FabreX technology creates a dynamic, open fabric that lets enterprises compose GPUs, CPUs, and storage on demand. The pitch is sovereign AI infrastructure: private, cost-effective data centres for organisations that cannot put sensitive workloads on shared infrastructure. The company works with the Department of Defense and with healthcare customers, and it has backing from investors including Mark IV Capital (Nucamp, 2026).
Sovereignty is not only about government. A hospital cannot send patient data to a shared cluster without controls. A defence supplier cannot let a foreign cloud see its designs. A European company must answer to GDPR. The decision is a spectrum, not a switch. Some workloads can live anywhere. Others must live in a named building, in a named country, under a named contract. The executive’s job is to sort the workloads into those buckets before the architects do.
Where does the talent come from?
Infrastructure is built by people, and the people are scarce. Regional demand for AI and machine learning skills in the Carlsbad area runs at more than double the supply (Nucamp, 2026). AI engineers earn $162,140 to $233,833. Viasat pays up to $249,000 for AI engineers. Qualcomm pays up to $272,000 for on-device AI roles. Those are not junior salaries. They are the price of scarcity.
The answer is not to outbid everyone. It is to build a pipeline. Berlin’s business services firms face the same arithmetic, and their scaling playbook reaches the same conclusion from a European capital’s point of view. UC San Diego sits twenty minutes south, and it feeds the region’s research base. The San Diego tech cluster feeds on that pipeline, and Carlsbad’s companies hire from it, fund it, and collaborate with it. Carlsbad’s companies hire from it, fund it, and collaborate with it. The city also retains people well: the climate is mild, the beaches are close, and the work is specialised enough to be interesting. An executive who treats talent as a procurement problem will lose. One who treats it as an ecosystem problem — universities, quality of life, interesting problems — will win.
What is composable infrastructure, and why does it matter now?
Traditional infrastructure is fixed. A server has a set number of GPUs, a set amount of memory, and a set amount of storage. When one workload needs more GPUs and another needs more memory, the fixed boxes waste both. Composable infrastructure breaks the box. It pools the resources and assembles them in software for each workload, then returns them when the job ends. The idea is old. The economics are new, because GPUs are now the most expensive part of the stack.
The GigaIO FabreX platform is the Carlsbad example. It creates a dynamic, open fabric that lets an enterprise compose GPUs, CPUs, and storage on demand, cutting the cost and complexity of large AI workloads. The company targets sovereign AI: private data centres for defence and healthcare customers who need control. The logic is simple. If a GPU costs tens of thousands of dollars, leaving it idle is the most expensive mistake in the building. Composability attacks idle time directly.
The hyperscalers agree, even if they use different words. Microsoft cut GPU deployment times by 20% quarter on quarter in the September 2026 quarter. That is a composability gain: faster provisioning, less waiting, more useful work per machine. The AI infrastructure market 2026 spans hardware, software, and services, and it is expected to grow from $35.42 billion in 2023 to $223.45 billion by 2030, a compound annual growth rate of 30.4%. Within it, the AI cloud infrastructure slice alone is projected to rise from $2.83 billion in 2024 to $74.15 billion by 2032, a 54.1% compound annual growth rate. When a market grows that fast, the winners are the ones who waste the least.
For an executive, the test is utilisation. Benchmarking is the discipline that makes the test honest: the same metric, measured the same way, before and after. Ask the team one number: what share of GPU capacity is actually doing useful work, averaged over a month? If the answer is below 60%, composability is worth a serious look. When the answer is unknown, that is the first problem to fix.
What does the satellite layer teach about resilience?
Viasat’s business is a lesson in building for the worst day, not the best one. A satellite network cannot be fixed by sending a technician. It must work the first time, in orbit, for fifteen years. That discipline shapes the whole company. Its fiscal 2026 revenue was $4.64 billion, split between Communication Services at $3.30 billion and Defense and Advanced Technologies at $1.34 billion. The company operates in the Ka-, L-, and S-bands, and it uses capacity from partner networks as well as its own fleet.
The resilience lesson applies to every enterprise. Redundancy is not waste. It is the price of uptime. Viasat’s network serves aircraft, ships, governments, and homes, and each segment has different failure modes. The company designs for all of them at once. An enterprise should do the same with its own stack: two providers where one would do, two regions where one would do, and a tested plan for the day the primary path fails.
There is a second lesson, about focus. Viasat does not try to be a general cloud provider. It owns one hard problem — connectivity anywhere on Earth — and it owns it deeply. Carlsbad’s whole ecosystem works the same way. Specialisation beats sprawl. An executive scaling an enterprise ecosystem should ask which hard problem the company truly owns, and build the infrastructure around that answer.
What does the biotech layer teach about regulated speed?
Carlsmed is the sharpest example of speed inside regulation. The company was founded in 2018 in Carlsbad. Its aprevo platform uses AI to design personalised spinal implants from a patient’s CT scan, then 3D-prints them in titanium. The platform holds FDA Breakthrough Device designation, and it is the only technology with that designation for both lumbar and cervical patient-specific interbody spine fusion. In January 2026, two-year clinical data for aprevo Lumbar appeared in the peer-reviewed Global Spine Journal. Reoperation rates fell 82.6% for patients treated with aprevo compared with traditional methods.
The business numbers match the clinical ones. The Carlsmed IPO in July 2025 listed the company on the Nasdaq under the ticker CARL, raising about $101 million by offering 6.7 million shares at $14 to $16 each. Preliminary full-year 2025 revenue reached about $50.5 million, up 86% year on year, beating the company’s own guidance of $45.5 million to $47.5 million. Fourth-quarter revenue was about $15.2 million, up 61%. The company is now running the full commercial launch of its aprevo Cervical system in 2026, after the first personalised cervical spine surgery in July 2025. A Series C round of $52.5 million in March 2024 had taken total private funding to roughly $110 million.
The lesson for executives is that regulation and speed are not opposites. They are a sequence. Carlsmed earned the Breakthrough designation first, published the data second, and scaled the commercial launch third. Each step made the next one faster. The infrastructure behind it — the CT pipeline, the AI design loop, the 3D-printing supply chain, the surgeon feedback loop — is a technical ecosystem in miniature. It scales because every layer was built to be measured. The 82.6% reoperation reduction is not a marketing claim. It is a number from a peer-reviewed journal. That is what high-velocity infrastructure looks like when the stakes are a human spine.
The wider cluster reinforces the point. Thermo Fisher Scientific anchors the region’s life sciences base. Genomic startups grow around it. The San Diego region’s life sciences and healthcare jobs grew 13–16% over the past decade. Sleep AI, another Carlsbad startup, raised $5.5 million for non-contact sleep tracking. The pattern is consistent across biotech infrastructure Carlsbad companies: deep science, disciplined data, and infrastructure that can prove its own results.
How much does slow infrastructure actually cost?
Slow infrastructure is a tax. It shows up as idle GPUs, waiting engineers, failed deployments, and customers who leave before the page loads. The worked example below makes the tax visible. ROI measurement across industries follows the same logic: name the spend, name the return, and state the assumptions. It is an illustration built from the benchmarks in this guide, with round numbers and stated assumptions. Treat it as a teaching tool, not a market figure or a promise.
Take a $60 million enterprise with a $6 million annual infrastructure budget. The split is typical for a mid-sized technology company: compute $3.6 million, network and connectivity $1.2 million, data and storage $0.7 million, and security and operations $0.5 million. Now assume the GPU fleet runs at 55% average utilisation, which is common for fixed infrastructure. That means $1.62 million of the $3.6 million compute spend is doing nothing useful. It is idle capacity, paid for in full.
| Line | Before | After composability |
|---|---|---|
| Annual infrastructure budget | $6,000,000 | $6,000,000 |
| Compute spend | $3,600,000 | $3,600,000 |
| Average GPU utilisation | 55% | 80% |
| Effective useful compute | $1,980,000 | $2,880,000 |
| Idle capacity recovered | — | $900,000 |
| Deployment wait, new AI workload | 6 weeks | 1 week |
| Engineering hours lost to waiting (illustration) | 1,200 hours a year | 200 hours a year |
Composable infrastructure lifts utilisation from 55% to 80% in this illustration. The recovered value is $900,000 a year on the same $3.6 million spend. The deployment wait falls from six weeks to one, because resources are assembled in software instead of ordered as hardware. Engineering hours lost to waiting fall from 1,200 a year to 200. At a loaded cost of $150 an hour, that is another $150,000 recovered. The total is about $1.05 million a year, on a $6 million budget, without buying a single new machine.
Sensitivity matters, so here are the cases. If utilisation only rises to 65%, the recovered value is $360,000, not $900,000. Should power costs rise 20% and the provider pass them through, about $180,000 of the gain disappears. If the team cannot retrain on the new fabric, deployment waits stay long and the engineering saving vanishes. The point is not the exact number. It is the shape of the maths: utilisation and waiting time are the levers, and both are measurable before any money is spent.
What are the seven mistakes that kill velocity?
The same seven mistakes appear in almost every stalled scaling programme. They are worth listing plainly, because each one is avoidable.
Why does buying hardware before measuring utilisation waste money?
Teams buy capacity to solve a queue, without checking whether the queue is caused by idle machines. Measure first. If utilisation is below 60%, the fix is scheduling and composability, not new boxes.
Why does choosing one cloud as a religion backfire?
A single provider is simple, until it raises prices, has an outage, or cannot serve a regulated workload. Keep at least one exit path. Portability is insurance, and insurance is cheap when it is bought early.
Why does ignoring power until the building is ready cost a year?
Grid connections are the longest lead item in the stack. Start the power conversation with the property conversation. A site without a power contract is a warehouse.
Why does data governance arrive too late?
Teams collect data for years, then discover they cannot use it because nobody recorded consent, ownership, or lineage. Write the rules when the pipeline is built, not after the audit letter arrives.
Why does hiring engineers before fixing the platform waste both?
New engineers on a broken platform spend their first months waiting. Fix the deployment pipeline first, then hire into it. Velocity is a property of the system, not the headcount.
Why does security get treated as a gate instead of a layer?
Security that arrives at the end slows everything down, because it finds problems that are expensive to fix late. Build it into each layer from the start. Sovereignty decisions belong in the design phase, not in the review meeting.
Why does nobody measure the cost of waiting?
Waiting is invisible in most budgets. Nobody invoices for the week an engineer waited for a GPU. Track it. Waiting time is the single best predictor of whether an ecosystem is fast or slow.
What does a 90-day blueprint look like?
A blueprint is only useful if it has dates. Rialto’s executive guide to scaling shows the same pattern in a logistics city, where systems let revenue grow faster than costs. The table below is a 90-day plan for an executive who wants to move from diagnosis to action. It assumes a mid-sized enterprise with a working stack, not a greenfield build.
| Days | Action | Measure of success |
|---|---|---|
| 1–10 | Audit the five layers: compute, connectivity, data, applications, people | One page per layer, with the bottleneck named |
| 11–20 | Measure GPU and server utilisation, latency to key sites, and waiting time | Three numbers, baselined and dated |
| 21–30 | Sort workloads into cloud, private, and edge buckets | Every workload assigned, with the reason written down |
| 31–45 | Start the power conversation for any planned expansion | A named contact at the utility, and a timeline |
| 46–60 | Run a composability pilot on one workload | Utilisation before and after, measured the same way |
| 61–75 | Write the data governance rules for the top five datasets | Owner, consent, and retention named for each |
| 76–90 | Decide the sovereignty buckets and the exit path from the main provider | A written decision, signed by the executive team |
Ninety days is short on purpose. The goal is not to finish the transformation. It is to know, with numbers, where the ecosystem stands. After that, the capital decisions get easier, because they rest on measurements instead of opinions.
Frequently Asked Questions
What is an enterprise ecosystem?
It is the five layers that must move together: compute, connectivity, data, applications, and people. When one layer lags, the whole system slows down. The ecosystem view exists to find the lagging layer before it becomes the bottleneck.
Why is Carlsbad a useful example for executives?
Because it is small and specialised. A city of about 111,835 people hosts a satellite giant, a biotech cluster, and a growing AI layer. Its ICT companies generate 1.6 times more patents per 1,000 workers than San Jose. Specialisation, not size, is the lesson.
How fast is the cloud infrastructure market growing in 2026?
Global cloud infrastructure spending reached $167.7 billion in the third quarter of 2026, up 55% year on year (Synergy Research Group). The growth rate has risen for twelve straight quarters, and the market has doubled in eight quarters. AI-specific services are about a third of the total.
What is composable infrastructure?
It is infrastructure that pools GPUs, CPUs, and storage, then assembles them in software for each workload. GigaIO’s FabreX is the Carlsbad example. The point is utilisation: expensive hardware should rarely sit idle.
What is the biggest bottleneck for hyperscalers now?
Power, cooling, and grid access. ABI Research projects hyperscaler IT load rising from 24.37 gigawatts in 2025 to 147.13 gigawatts in 2035, while site counts rise only modestly. The constraint is physics, not money.
How does a company start scaling its infrastructure?
Measure first. Audit the five layers, baseline utilisation, latency, and waiting time, then sort workloads into cloud, private, and edge buckets. The 90-day plan in this guide gives the sequence. Capital follows measurement, not the other way round.
Carlsbad’s lesson is not that every city should copy its clusters. Scaling enterprise ecosystems is a discipline, not a purchase. It is that velocity comes from alignment. Viasat aligns connectivity with the places its customers actually are. Carlsmed aligns AI, data, and regulation into one clinical loop. GigaIO aligns hardware with the workloads that need it, in software, on demand. Each one is a different answer to the same question: what breaks next if this layer grows?
Business excellence, as an operating system, starts with exactly this kind of question. That is the question to take into the next board meeting. Answer it with numbers — utilisation, latency, waiting time, power — and the blueprint writes itself. The infrastructure market will keep growing whether any single company acts or not. Cloud spending is up 55% year on year. Hyperscaler capacity is heading for 228.96 gigawatts. The only choice is whether your ecosystem keeps pace, or watches the fast ones disappear over the horizon.