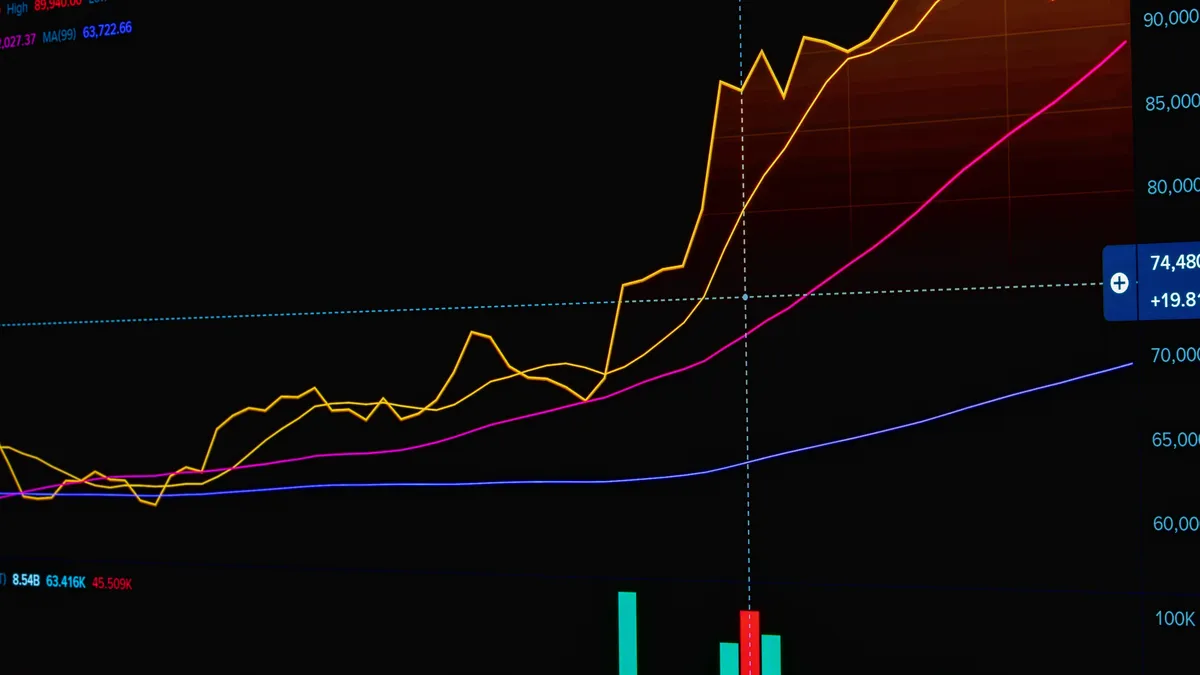


A trader in Chicago watches the consumer price report land at 8:30 in the morning. Her screen shows the S&P 500 futures jump, then fall back. All of it happens inside three seconds. She clicks buy. The order leaves her laptop and crosses her internet connection. Then it passes her broker’s risk checks. Finally it reaches the exchange and comes back filled — six ticks worse than the price she clicked on. Nothing about her idea was wrong. The market simply moved while her order was travelling. That gap is what trading execution speed is really about. It is the space between the price you decide on and the price you actually get.
Speed in trading is often sold as a race for bragging rights. In practice it is a cost. Every millisecond between a decision and a fill is a chance for the price to move against you. A stop order can trigger late in that gap. A quote can vanish before your order reaches it. This guide explains what speed actually means. It also explains who is racing and who is not, and how a modern market works. And it explains what a regular trader can realistically do about it, in trading execution speed 2026 terms.
What does “speed” actually mean in trading?
When traders talk about speed, they usually mean latency. Latency is the delay between a trading decision and the order reaching the exchange. It also covers the delay before the fill comes back. Latency is not one number. It is a chain of small delays. Each link in the chain belongs to somebody different. Order execution latency is the sum of all of them.
| Step in the journey | What happens | Typical delay |
|---|---|---|
| Signal to click | You see the price, decide, and click — or your software generates the signal | Milliseconds to seconds for a person; microseconds for software |
| Your device and connection | The order travels from your computer to your broker over the internet | 1–10 ms on a VPS near a financial centre; 50–200 ms on a standard home connection |
| Broker risk checks | The broker verifies funds, margin and order validity before forwarding | 10–50 microseconds at a fast firm; more at a slow one |
| Routing to the exchange | The order travels to the matching engine, often across cities | Microseconds if co-located; milliseconds if far away |
| Matching and fill | The exchange matches the order against the book and confirms | Under 500 nanoseconds inside Nasdaq’s matching engine |
| Confirmation back to you | The fill report travels home so your screen can show it | Same path in reverse |
Two traders on the same broker can experience very different real-world execution. Published speed numbers describe only the broker’s own server-side processing. They do not cover the full delay from your device, your internet connection and the broker’s liquidity provider. A co-located firm operates at roughly 30–45 microseconds of latency. A retail trader through a standard broker connection sits at 150–300 microseconds or more. That gap of 100–250 microseconds is invisible to a swing trader. It is irrelevant to anyone holding a position for hours. And it is everything to a scalper.
Light in fibre travels at roughly two-thirds of its speed in a vacuum. That works out to about 5 milliseconds per 1,000 kilometres one way. Distance is therefore a hard limit. No amount of clever code can remove it. This is why the fastest firms do not try to beat physics from far away. They move next to the exchange instead.
Why does a few milliseconds change the price you get?
The cost of slow execution has a name: slippage. Slippage is the difference between the price you intended to trade at and the price you actually got filled at. It is not a fee on a statement, and it never appears as a line item. Instead it arrives as a slightly worse price, trade after trade. The slippage trading creates is small per trade and large per month.
Take a scalp trade targeting 2 pips. A 200-millisecond execution delay versus a 40-millisecond fill can decide whether you enter at your planned price or chase the market. Half a pip of slippage on a 2-pip target costs 25% of the planned profit. Spreads and commissions have not even been counted yet. An automated strategy executing 50 trades a day, with average slippage of 0.3 pips from a slow broker, loses the equivalent of 15 pips a day in invisible costs. Over a month, that is 300 pips of missed performance. It would not appear in any single trade review. Yet it completely changes whether the strategy is profitable.
| Slippage per trade | Trades per day | Hidden cost per day | Hidden cost per month |
|---|---|---|---|
| 0.1 pips | 50 | 5 pips | 100 pips |
| 0.3 pips | 50 | 15 pips | 300 pips |
| 0.5 pips | 20 | 10 pips | 200 pips |
| 1.0 pips | 10 | 10 pips | 200 pips |
The table above is an illustration with round numbers, not a measured result. It exists to show the shape of the problem. Stop-loss orders suffer the same way. A slow broker may not trigger a stop at the set price when the market moves quickly during a news release. The result is a larger loss than planned. Stop loss slippage is the version of this problem that hurts most, because it strikes exactly when you are already losing. Execution cost compounds with frequency. Someone taking one trade a week barely notices a small consistent slippage cost. A trader taking ten trades a day pays that cost ten times as often.
Broker-published benchmarks put typical execution at 30–35 milliseconds for major ECN brokers on major pairs. Leading ECN brokers can fill orders in just 30–40 milliseconds. Some market makers take over 100 milliseconds. The real cost gap between genuinely good and poor execution quality is estimated at 2–3 pips per trade. Anything under 100 milliseconds is acceptable for most strategies. Under 50 milliseconds is good for scalping. But these numbers are broker-published or test-based, not universal guarantees. The same broker can behave very differently during a news release, a session open, or a high-volatility window.
Who is actually racing — and who is not?
High frequency trading 2026 is the fastest corner of automated markets. It shapes the cost of nearly every trade an American makes. HFT firms run on hardware measured in nanoseconds. They account for a large share of daily United States equity volume. By most estimates that share is more than half. It peaked above 60% in 2009 and has sat around 50% since 2010. In 2024, HFT firms collectively accounted for more than 50% of all US equity order flow. Around 70% of US equity trading volume is handled by algorithmic systems of one kind or another. Most estimates place the algorithmic share of major global equity markets at 60–75% of total volume. The exact percentage varies between exchanges, countries and market conditions. Different trackers disagree on the precise figure. The range, not a single number, is the honest way to state it.
The HFT volume share is therefore best quoted as a range: roughly half to more than two-thirds, depending on the market and the measure.
Six principal firms alone supply an estimated 30% to 40% of displayed depth on major venues. Citadel Securities is the largest designated market maker on the New York Stock Exchange. It handles an estimated 25% of all US equity trading by volume. Jane Street averaged $707 billion in monthly ETF trading volumes in 2024. It captured 24% of the primary US-listed ETF market and 16% of the secondary market. Its share of North American equity trading volumes passed 10%. These are not retail operations. They are technology companies that happen to trade. Algorithmic trading volume now dominates the market, and a small group of specialist firms dominates the fastest tier of it.
Low-latency trading means cutting the delay between a trading decision and the order reaching the exchange. High-frequency trading is one strategy style that depends on extreme low latency. It runs huge numbers of very short-lived trades, on servers next to the exchange. Every HFT firm needs low latency. Most low-latency traders are not HFT. The distinction matters. It decides whether speed is your edge or merely your cost.
| Low-latency trading | High-frequency trading | |
|---|---|---|
| What it is | Making order execution as fast as practical | A strategy that profits from tiny, very short-lived price moves |
| Speed that matters | Milliseconds | Microseconds or less |
| Holding period | Minutes to days | Seconds or fractions of a second |
| Where the edge comes from | The strategy’s logic | Being faster than other participants |
| Who can do it | Any serious trader with a good setup | Firms with co-located servers and custom hardware |
A retail order goes from your platform to your broker over the internet. It passes through the broker’s risk checks. Then it reaches the exchange. Each step adds delay. An HFT firm’s order starts inside the exchange’s building. No retail setup closes that gap, and none needs to. Most edges available to retail traders do not depend on being first. Selling options to collect time decay plays out over hours or days. Trend-following on a 15-minute or daily chart does not care about a few hundred milliseconds. Mean-reversion and rebalancing strategies trade far less often still. What hurts these strategies is the price you actually get. That is where execution quality, not raw speed, becomes the real question.
Where does the race actually happen?
The meaningful action in US equity trading takes place inside a handful of data centres in New Jersey. That is where the major exchanges run their matching engines. Equinix’s NY4 and NY5 facilities, alongside the Carteret site and others, host the cabinets where the leading trading firms physically place their servers. A market-data packet leaves a Nasdaq matching engine in Carteret, New Jersey. From there it traverses a tightly tuned cross-connect. Then it hits a co-located trading server, runs through a risk check and a decision model. A new order returns to the exchange in single-digit microseconds. That round trip is the unit of competition in US equity markets in 2026.
Typical cabinet rental at these facilities runs into the tens of thousands of dollars per month. Cross-connect fees and bandwidth costs sit on top. For a serious HFT operation, the all-in physical infrastructure spend in a single New Jersey data centre can run well into the millions per year. That cost is justified only because the alternative leaves microseconds on the table. Competitors will not leave them there. Colocation trading firms pay it gladly, because the microseconds are the business.
Microwave and millimetre-wave links between New Jersey and Chicago carry index futures and ETF prices between the two main US trading centres. They remain a real source of advantage. The leading firms invest in private spectrum, tower height and weather-resilient design. The goal is to keep these links operating during conditions that knock less-engineered competitors offline. Fibre is fast, but radio waves travel through air faster than light travels through glass. Over the roughly 1,100 kilometres between Chicago and New Jersey, that difference is worth real money.
Inside the co-located server, the remaining delays are engineered away piece by piece. Network cards skip the operating system’s network stack entirely. Kernel bypass using DPDK or similar technology shaves 5–15 microseconds. Sub-microsecond switch fabric, dark fibre loops and dedicated point-to-point connections replace shared internet routes. Round-trip latency at top-quartile US venues now sits in the high-single-digit microseconds for the leading proprietary trading firms. Intra-host latency budgets are discussed in nanoseconds. Nasdaq advertises order-to-ack and market-data order-to-tick latency below 50 microseconds for its co-location service. Some specialised setups reach sub-20 microseconds for the network transmission portion alone. At the retail level, trading latency milliseconds still decide the fill — and the gap between the two worlds is the whole story.
What happens to your order after you click buy?
For most retail traders, the order never goes straight to an exchange. It goes to a wholesale market maker. When you place a stock or options order, your broker routes it to a market maker for execution. Market makers are firms like Citadel Securities, Virtu Financial and G1 Execution Services. They pay your broker a small fee for receiving that order. That fee is called payment for order flow.
In 2025, payment for order flow generated $4.8 billion in revenue across the US retail brokerage industry. Robinhood alone collected over $600 million. Citadel Securities now handles approximately 45% of all retail stock orders in the US, up from 41% in earlier years. Virtu Financial handles around 26%. G1 Execution Services handles approximately 16%. The top three market makers control over 85% of retail order execution in the US. Citadel Securities alone executes approximately 35% of US-listed retail volume. It handles over 24% of total US equity market volume. Retail order flow is therefore concentrated in very few hands.
Options flow commands a premium. US options payment for order flow reached $1.004 billion in the second quarter of 2026. That was the first quarterly total above $1 billion. It rose 23.6% from the first quarter, an annualised pace above $4 billion. The average retail options transaction yields approximately 40 cents per 100 shares for a broker. That is roughly twice the approximate 20 cents earned on an equivalent stock trade. The figures come from research by Thomas Ernst of the University of Maryland and Chester Spatt of Carnegie Mellon University, published in the Review of Financial Studies in February 2026. Citadel and Susquehanna control over 60% of designated market maker slots. They handle more than 70% of retail options order flow.
The standard defence of payment for order flow is price improvement. Market makers argue, and have data to support, that they frequently fill retail orders at prices better than the National Best Bid and Offer. The NBBO is the best quoted bid and ask across all exchanges. Under NBBO best execution rules, a fill better than the quote counts as price improvement. This is true in a narrow sense. A retail market order for 100 shares might get filled a tenth of a cent better than the posted best price. That improvement is real.
It is also the smaller part of the story. Studies and regulatory filings suggest that payment for order flow can add roughly 10% to 20% to the effective spread of a trade. If the quoted spread on a stock is $0.10, the actual spread paid by a retail investor routed through a payment-for-order-flow-dependent broker might be $0.12 or more. The extra $0.02 per share may sound trivial. For active traders or large orders, it adds up quickly.
Payment for order flow remains legal in the US, subject to disclosure and best-execution duties. In Europe, the picture is different. The EU’s MiFIR Article 39a banned payment for order flow, with the ban taking effect on 30 June 2026. Regulation varies by country. A practice that is standard in one market can be prohibited in another. Market microstructure is not the same everywhere, and the rules are part of the structure.
How do you know if your execution is good?
For years, execution quality was hard to measure because the reporting was thin. That changed in 2026. The US Securities and Exchange Commission adopted amendments to SEC Rule 605 of Regulation NMS on 6 March 2024, in a unanimous vote. It was the first substantive revision since the rule was implemented in 2000. After the SEC extended the compliance date to give market participants more time, collection of the new, finer execution quality data began on 1 August 2026. The first revamped Rule 605 reports were published on 1 October 2026.
The amended rule is much more descriptive than the old one. It extends reporting beyond market centres. Coverage now reaches broker-dealers with 100,000 or more customer accounts. Single-dealer platforms are covered too. So are alternative trading systems reporting separately from their broker-dealer operator. Order types and sizes that were previously outside the categories entirely are covered too. These include odd lots, fractional shares, stop orders, non-marketable limits that become executable, and non-exempt short sales. Sizes are bucketed by notional value rather than share count. Average time to execution is measured in increments of a millisecond or finer, with the fastest time bucket under 100 microseconds. Realised spread is now measured at five horizons, from 50 milliseconds to 5 minutes after execution. From November 2026, additional price-improvement statistics must also account for the best odd-lot order through a new Best Available Displayed Price benchmark.
Rule 606, the companion rule, requires broker-dealers to report where they send customer orders. It also requires them to report the payments received from execution venues. Together, Rules 605 and 606 give a trader the raw material to compare brokers on something other than the advertised spread. Fidelity’s research on the new disclosures notes that dealer competition and clearer disclosures have already contributed to better trade execution. In a recent survey of retail investors, the most influential factors shaping perceptions of execution quality were speed of execution and fill rate. Price improvement ranked closely behind. The same research estimates that poor execution can erode returns by 20 to 300 basis points annually for high-turnover strategies. That range makes execution a portfolio-level issue, not a technical footnote. Execution quality metrics turn this from a feeling into a number, and a number can be improved.
Which order types protect you when the market moves fast?
Speed is not only about infrastructure. It is also about the instructions you attach to an order. The order type you choose decides how your order behaves when the market moves. The wrong type in a fast market can cost more than any latency saving. The limit order vs market order decision is the first execution choice a trader makes, and it is the one most often made on autopilot.
A market order says “fill me now, at whatever price is available.” It is the fastest way to get filled, and also the most exposed to slippage. The reason is simple: it accepts whatever the book offers at the moment it arrives. A limit order says “fill me only at this price or better.” It controls the price but not the fill. In a fast market, a limit order can sit unfilled while the market runs away. A stop order becomes a market order once a trigger price is reached. It inherits the market order’s slippage exactly when volatility is highest. A stop-limit order adds a price cap to the stop. It protects the price but risks no fill at all if the market gaps through the limit.
| Order type | What it guarantees | What it risks | When it helps |
|---|---|---|---|
| Market order | A fill, almost always | Slippage in fast markets | Liquid stocks in calm conditions |
| Limit order | Price, or better | No fill if the market runs | Entries at a level, exits at a target |
| Stop order | An exit once triggered | Slippage after the trigger | Hard risk control, accepted slippage |
| Stop-limit order | Price after the trigger | No fill in a gap | Thin or gapping markets, with care |
| Immediate-or-cancel | No stale order left behind | Partial fills | Large orders, probing liquidity |
The practical rule is simple. Use market orders only where the spread is tight and the book is deep. Limit orders belong wherever the price matters more than the fill. And never assume a stop order will fill at the stop price. In a gap, it will not. The opening minutes of a session are the worst time for market orders. Spreads are widest then and the book is thinnest. Avoiding the first few seconds of the open, unless your strategy needs them, is one of the cheapest execution improvements available.
Where does speed help — and where does it not?
Not every strategy cares about speed equally. The table below is a guide, not a rulebook. Any strategy can be hurt by bad fills. But the sensitivity differs by orders of magnitude. Knowing where your strategy sits saves you from spending money on speed you do not need. It also saves you from ignoring speed you do need.
| Strategy | Holding period | How much speed matters | What matters more |
|---|---|---|---|
| Scalping | Seconds to minutes | Decisive — the whole edge can be slippage | Sub-50 ms fills, tight spreads, deep book |
| Day trading | Minutes to hours | High — entries and exits both pay slippage | Limit orders, avoiding the open, measuring fills |
| Algorithmic / automated | Varies | High — backtests assume fills that live trading may not deliver | Realistic slippage in backtests, stable connectivity |
| Swing trading | Days to weeks | Low — a few hundred milliseconds rarely matter | Position sizing, trend quality |
| Position / long-term | Months to years | Negligible | Valuation, diversification, costs over years |
| Options selling | Hours to days | Low for entry; higher at expiry | Time decay, implied volatility, assignment risk |
Low latency helps any strategy that needs a specific price. Breakouts at a level qualify. Stop-losses in a fast market qualify. Orders at the open qualify. Low latency does not create an edge by itself. A strategy with no edge does not become profitable because its orders arrive faster. It simply loses money faster, at slightly better prices. The right question is not “how fast am I?” It is “how much does the price I get differ from the price my signal fired at?” Then ask whether that difference is small relative to your average profit per trade. When the difference is small, speed is not your problem. A large one makes speed the cheapest fix you have.
What does a worked example look like?
Consider a day trader with a simple setup. She risks $200 per trade and targets $400. Her usual pace is ten trades a day, and her strategy wins 45% of the time before execution costs. The illustration below uses round numbers. It is not a market figure or a promise — it exists to show how execution costs change the maths.
| Scenario | Average slippage per trade | Daily cost (10 trades) | Monthly cost (20 days) |
|---|---|---|---|
| Clean fills | $0 | $0 | $0 |
| Good execution | $5 | $50 | $1,000 |
| Average execution | $15 | $150 | $3,000 |
| Poor execution | $30 | $300 | $6,000 |
At $15 of average slippage per trade, the trader pays $3,000 a month for execution quality she never sees on a statement. Double that to $30, and she pays $6,000 — while her strategy, profitable on paper, is now losing money. The sensitivity cases tell the same story from the other side. Halving slippage from $30 to $15 is worth $3,000 a month. That is more than most traders spend on data, software and education combined. Improving the fill is often cheaper than improving the strategy.
Now consider the other end of the spectrum. A long-term investor buys $10,000 of a broad index fund once a quarter. She pays the same $15 of slippage four times a year — $60 in total. For her, speed is irrelevant. The lesson is not that speed always matters. It is that speed matters in proportion to frequency. Frequency is the multiplier most traders forget to apply.
What changed in 2026?
Three changes in 2026 reshaped the execution landscape for ordinary traders. None of them was about faster hardware.
First, the amended Rule 605 reporting began on 1 August 2026, as described above. For the first time, large broker-dealers must publish execution quality statistics in the same standardised format as exchanges. The reports cover odd lots, fractional shares and stop orders. Time-to-execution is measured in milliseconds or finer. A trader can now compare brokers on effective spread, price improvement and fill speed using public data instead of marketing claims. The first revamped reports appeared on 1 October 2026. The Best Available Displayed Price benchmark arrives in November 2026.
Second, the European Union’s ban on payment for order flow took effect on 30 June 2026 under MiFIR Article 39a. European brokers can no longer be paid to route retail orders to a specific market maker. The US has not followed. Payment for order flow remains legal there, subject to disclosure and best-execution duties. The contrast is now a live experiment in market design. Traders who operate in both regions will see the difference in their fills.
Third, US equities are moving towards round-the-clock trading. What does 24 hour trading 2026 mean for the price you get? Nasdaq and NYSE plan to run a trading schedule from Sunday at 9:00pm Eastern Time through to Friday at 8:00pm. The schedule breaks only for a planned one-hour maintenance window each evening. It starts from 6 December 2026.
The SEC held a roundtable on 17 September 2026 to examine the consequences. The agenda covered overnight surveillance, clearing and settlement, investor protection, cybersecurity and market-data continuity. Overnight activity is still a small slice of the US equity market. SEC figures show it represented only 0.9% of National Market System share volume in August 2026. But average daily overnight volume jumped 359% year on year to roughly 144.6 million shares. More than 4,200 NMS stocks traded overnight on a typical day.
Thinner overnight order books mean wider spreads. Wider spreads mean execution quality matters even more after hours than it does at midday. Much of the flow never reaches a lit exchange at all. Dark pools ATS venues, wholesalers and lit exchanges all compete for the same order, and the mix changes by the hour.
Retail participation itself is shifting. The retail share of total US stock volume has declined to about 9%. That is near its lowest level since 2020, down from around 15%. US households net bought about $840 billion in stocks during the first half of 2026. Stock mutual funds and exchange-traded funds attracted about $350 billion in the same period. The wealthiest 10% of US households hold about 87% of household equity assets. None of this changes the mechanics of execution. It changes who is on the other side of your order. In a market where most volume is algorithmic, the other side is usually a machine.
What can a regular trader actually do about speed?
You cannot co-locate a server next to the Nasdaq matching engine from a home office. Nor do you need to. The practical improvements are smaller, cheaper and — for most traders — worth more than the exotic ones.
Start with the connection. A wired ethernet connection beats Wi-Fi for stability. A virtual private server located near a financial centre typically achieves 1–10 milliseconds of latency. A standard home connection manages 50–200 milliseconds. A VPS also keeps your platform running when your home internet drops. That matters more than raw speed for anyone running automated strategies. Choose a broker whose servers are near the exchange you trade most. Prefer a broker that publishes execution statistics over one that only advertises tight spreads.
Next, measure your own slippage. Compare your fill prices with the price when your signal fired. Put that number into your backtests. Most platforms show the fill price. Few traders write it down. A simple log turns execution from a feeling into a number. Record the date, the instrument, the signal price, the fill price and the difference. A number can be improved. If your slippage is small relative to your average profit per trade, speed is not your problem. When it is large, the fix is usually an order type, not a new computer.
Use limit orders where the price matters more than the fill. Avoid market orders in the first seconds of the open, when spreads are widest. Check your broker’s Rule 605 and Rule 606 disclosures at least once a year. Compare them with a competitor’s. If your broker’s effective spread is consistently wider than the quoted spread by more than the price improvement you receive, you are paying for the privilege of being routed there. Consistent negative slippage in one direction — always worse for you, never better — is a pattern worth taking seriously. Random noise should show up roughly evenly in both directions over enough trades.
What are the 7 mistakes traders make about speed?
Is faster hardware the answer to a losing strategy?
No. A strategy with no edge does not become profitable because its orders arrive faster. It loses money faster, at slightly better prices. Fix the idea first, then the infrastructure.
Does the tightest spread always mean the cheapest trade?
No. A broker with a slightly wider spread but consistently fast, fair execution can cost less in practice. Compare it with one that has a tighter advertised spread and frequent slippage. Two brokers can quote the exact same spread and still cost you very differently.
Should you chase the fastest broker for a long-term portfolio?
No. A long-term investor buys once a quarter and pays slippage four times a year. For that trader, reliability, custody and cost matter far more than milliseconds.
Is a market order always the fastest way to trade?
It is the fastest way to get filled, but it is also the most exposed to slippage. In a fast market, a market order can fill far from the price on your screen. Speed of fill and quality of fill are different things.
Can you win the speed race as a retail trader?
No, and you do not need to. An HFT firm’s order starts inside the exchange’s building. Your edge, if you have one, lives in your idea, your timeframe and your discipline. It does not live in being first by a microsecond.
Does speed matter equally in every market?
No. Speed matters most in liquid, fast-moving markets with tight margins. Scalping forex majors qualifies. Trading index futures around news qualifies. Running an automated strategy qualifies. It matters least in illiquid markets, where the spread and the lack of depth dominate everything else.
Is execution quality something you check once and forget?
No. Brokers change routing, market makers change pricing, and volatility changes everything. The amended Rule 605 reports now arrive monthly. That makes a yearly check easy — and a yearly check is the minimum.
Frequently Asked Questions
How fast is fast enough for a retail trader?
Fast enough that the price you get is close to the price when your signal fired. Measure your slippage. If it is small relative to your average profit per trade, speed is not your problem. For most strategies, fills under 100 milliseconds are acceptable. Under 50 milliseconds is good for scalping.
What is the difference between latency and slippage?
Latency is the delay between a decision and an order reaching the market. Slippage is the price difference that delay — and other factors — can cause. Latency is measured in time. Slippage is measured in money. Low latency reduces slippage, but it is not the only cause of it.
What is the NBBO and why does it matter?
The National Best Bid and Offer is the best quoted bid and ask across all US exchanges for a given stock. It is the benchmark against which execution quality is measured. Price improvement means filling better than the NBBO. Effective spread measures what you actually paid relative to the NBBO midpoint at the time your order arrived.
Does payment for order flow hurt retail traders?
The evidence is mixed, and the debate is live. Market makers do provide price improvement — fills better than the NBBO — and that improvement is real. Critics point out that the improvement is often smaller than the payment the broker receives. Studies suggest payment for order flow can add roughly 10% to 20% to the effective spread. The honest answer is that it depends on your broker, your order type and your trading frequency. That is why the Rule 605 and 606 disclosures exist.
What is co-location and do I need it?
Co-location means placing your trading servers inside or adjacent to the exchange’s data centre. They connect by dedicated fibre to the matching engine. It cuts round-trip latency to single-digit microseconds. Unless you run a high-frequency or latency-sensitive automated strategy, you do not need it. A VPS near a financial centre gives you most of the practical benefit at a fraction of the cost.
Will 24-hour trading change execution quality?
Probably, in both directions. More hours mean more opportunity, but overnight books are thinner and spreads are wider. Execution quality after hours is likely to be worse than at midday. The SEC’s September 2026 roundtable flagged thinner overnight order books, wider spreads and the practical difficulty of handling problems at 3:00am. Traders who venture into overnight sessions should use limit orders and smaller size until they have measured their own fills.
Speed in trading is not a trophy. It is a cost, a risk control, and — for a few strategies — an edge. The market of 2026 is faster than any market before it. Matching engines measure time in nanoseconds. More than half of US equity volume is algorithmic. The reporting that lets you judge your own execution is finally detailed enough to use. The traders who benefit are not the ones with the fastest servers. They are the ones who know how much speed their strategy actually needs. Their habit is simple: measure what they actually pay, then choose order types and brokers accordingly. Trading execution speed is part of your return, because the price you get is part of your return. Treat it that way.
Educational content only. This article is not investment advice, and it does not recommend buying or selling any security, market or product. Trading involves risk, including the possible loss of capital. Regulation, tax treatment and market rules vary by country — check the rules that apply where you trade.
For context on the financial world this article sits in, see how a single stock can move from theme-park toys to a listed company, how Boston’s asset-management firms think about marketing their services, how New York financial firms benchmark their marketing, how financial services firms in Mumbai approach digital marketing, the same question from Bogotá’s financial sector, and how Ahmedabad’s financial firms measure their marketing return.